Linux System IO monitoring


"Every thing is a file", is a very famous Linux philosophy. There is a reason for this philosophy to get famous. The main reason behind this is the fact that, Linux operating system in itself works on the same philosophy.
You might think that how can an operating system work on a philosophy like "Everything is a file".
Its because, Linux operating system consider's and work's with the below devices, by the same way we open and close a file.
- Block devices(Hard-disks,Compact Disk's,Floppy,Flash Memory)
- Character devices or serial devices (Mouse, keyboard)
- Network Devices
A user can do operations on these devices, by exactly the same way, he does operations on a file.
The main advantages with block devices is the fact that they can be read randomly. However, serial devices can be operated only serially(data from them can only be accessed as the order they come, not in a random manner.)

 The main advantage of using block devices is that, if allows access to random location's on the device. And data from the device is read with a fixed block size.
Input and output to the block devices works on an algorithm called the "elevator algorithm"
This says that it works on the same principle, as an elevator would work. For example, if an elevator is going to a top floor, it will not accept any "go down" request until it completes its top floor request(of course it will stop in places in between the top floor, if there are people to get in...But they should all be going to top floor or atleast in that same direction).
Mecahnical devices like hardisk's are very slow in nature, when it comes to data input and output compared to system memory(RAM) & Processor.
Sometimes applications has to wait for the input and output requests to complete, because different applications are in queue for its input output operations to complete.
The slowest part of any Linux system(or any other operating system), is the disk I/O system's. There is a large difference between, the speed and the duration taken to complete an input/ouput request of CPU,RAM, and Hardisk.
Sometime's if one of the process running on your system, does a lot of read/write operatins on the disk, there will be an intense lag or slow response from other process because they are all waiting for their respective I/O operatins to get completed.
Linux operating system, handles this problem of disk I/O in a very different way. Lets see how.
There is a very famous "free" command in linux to check free RAM available. Lets see the output of free command.
[root@slashroot1 ~]# free -m
             total       used       free     shared    buffers     cached
Mem:           503        277        225          0         89        150
-/+ buffers/cache:         38        465
Swap:          996          0        996
[root@slashroot1 ~]#
There are three "rows" in the output. "Mem:","-/+ buffers/cache", and "swap". Most of the system administrator's get panic, when they see this output(because they only look at the first row of the output.). According to which i only have 225 mb of memory free.
But in reality i have 465MB memory free from the total of 503MB(which is evident from the second row of the output"-/+ buffers/cache").
So is that first row of the output telling me some wrong info? No. infact the first row of the ouput is also correct Let's see what's the difference.
Let's run /usr/bin/time command (time command will give you the time taken to run a command)with -v option and see the ouput.
command: /usr/bin/time <any command>
Command being timed: "ls"
        User time (seconds): 0.00
        System time (seconds): 0.00
        Percent of CPU this job got: 28%
        Elapsed (wall clock) time (h:mm:ss or m:ss): 0:00.01
        Average shared text size (kbytes): 0
        Average unshared data size (kbytes): 0
        Average stack size (kbytes): 0
        Average total size (kbytes): 0
        Maximum resident set size (kbytes): 0
        Average resident set size (kbytes): 0
        Major (requiring I/O) page faults: 0
        Minor (reclaiming a frame) page faults: 249
        Voluntary context switches: 1
        Involuntary context switches: 20
        Swaps: 0
        File system inputs: 0
        File system outputs: 0
        Socket messages sent: 0
        Socket messages received: 0
        Signals delivered: 0
        Page size (bytes): 4096
        Exit status: 0
if you see the second last line of the ouput, it says that "Page size (bytes): 4096". That tells that our page size is 4096 bytes. Linux operating system, breaks the I/O into pages and the default on many distrbution is 4096 bytes. Which mean's it read's the writes blocks into and out of memory(RAM) with 4096 bytes page size.
Whenever an application starts, the Processor looks at its memory pages(blocks stored in CPU cache), and then RAM for the data. If data for the required application is not present in both the places, then it will ask hardisk for the data blocks. This process is called as Major Page Fault. In other words, Major Page Fault is a request, done to fetch pages from the hard disk and buffer it to RAM.
And if the data is present in the RAM buffer cache, the processor can issue a Minor Page fault(which is faster, because its in the RAM, to fetch data pages from buffer cache).
Major Page fault will take some time because its an I/O request to the disk drive. And minor page fault is issued, almost all of the time's because almost all data is accessed, only after they are in RAM buffer cache.
So an application when started for the first time will take a little bit more time to execute because of the "Major Page Fault"(as the data is not in the RAM buffer cache, and cpu cache and needs to be fetched from the hard disk.) Let's see this practically.
I am going to start "elinks"(the text based linux browser) for the first time in my system. And lets calculate the Minor and Major page fault..
Note: I have not shown the complete output of the below command, as it is very large, you can see the major and minor page faults in the output
[root@slashroot1 ~]# /usr/bin/time -v elinks
Major (requiring I/O) page faults: 13
Minor (reclaiming a frame) page faults: 790
Now i will start the same elinks browser second time. Now you will be amazed to see that the major(requiring I/O page faults will be zero.) see below
[root@slashroot1 ~]# /usr/bin/time -v elinks
        Major (requiring I/O) page faults: 0
        Minor (reclaiming a frame) page faults: 733
And from the above output, if you notice there is not much difference in minor page faults(because that's always needed, as the kernel caches everything in RAM and then is used by the processor).
So in order to reduce the "Major Page faults", the kernel tries to buffer cache as much blocks as possible, so that it can be retrieved very fast, the next time.
So the output we previously saw from "free" command, is correct in its first row of output also(because a large amount of RAM is used for this buffer caching done by the kernel.).
But an important fact to understand here is that, there is no need to worry because the kernel will remove the pages whenever an application needs memory(this buffer cache memory is just a mechanism done by the kernel to reduce disk I/O. It will never steal memory from other process, or will never act as a memory bottleneck. Infact it will increase the performance of the system.)
So, in order to determine the actual memory used, always look at the second row of the "free" command ouput(-/+ buffers/cache)
Buffer caching is a mechanism of the kernel to reduce Major Page faults(which are slow), and increase the Minor Page Faults(which is fast, because all is in RAM)
The more I/O operation an operating system does, the more it saves buffer caches for faster I/O. But dont worry, your applications are given more priority whenever memory is needed by them
There are several system monitoring tools in linux, that can be used to monitor, I/O, usage. they are mentioned below.
- sar
- vmstat
- top
- iostat
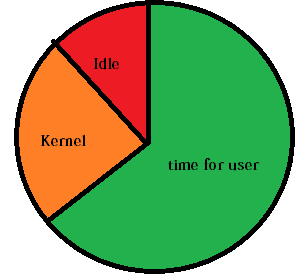
In an ideal situation the processor time is largly devoted to user, and some to kernel and some is idle.
Which is depicted in the below diagram.
Wait on I/O, is a situation caused to the processor, when there are large number of application's just waiting for their I/O operatins to get completed. In such cases, CPU becomes idle, as its waiting for the input/output request to get completed.
In otherwords, some or the other application might be doing a large number of Major Page fault(which results in other application to wait for their Major page fault to get completed).
Let's see how to monitor "Wait on I/O" with the help of vmstat command in linux.
[root@slashroot1 ~]# vmstat 2
procs -----------memory---------- ---swap-- -----io---- --system-- -----cpu------
 r  b   swpd   free   buff  cache   si   so    bi    bo   in   cs us sy id wa st
 0  0      0  73588 110056 277556    0    0    72     8 1015   30  1  1 98  0  0
 0  0      0  73588 110056 277556    0    0     0     0 1013   20  0  0 100  0  0
 0  0      0  73588 110056 277556    0    0     0     0 1014   26  0  1 100  0  0
 0  0      0  73588 110056 277556    0    0     0    14 1015   23  0  0 100  0  0
in the above shown output of vmstat command, notice the last column "CPU". This column tells the time that processor is spending on user,system,idle,and wait on io(wait on io is shown by the "wa" column in the cpu section of the output.)
In the above output "wa", is zero and also the idle time is 100 percent. Which means there is nothing running on the system.
If there is a case where "wa" is showing higher values, then there is an IO bottle neck. Higher wait on io means, cpu is waiting for I/O requests of different applications to get completed.
"bi" column in the vmstat ouput shows the blocks that are read in to RAM from the disk. If this is larger along with "wa", then that assures you that large data is being read into memory from the disk, which is causing wait on io.
SAR (System Acitivity Reporter) command in linux, can also be used to determine "wait on io"
[root@myvm1 ~]# sar 1 7
09:31:17 PM       CPU     %user     %nice   %system   %iowait    %steal     %idle
09:31:18 PM       all      0.99      0.00      0.00     72.28      0.00     26.73
09:31:19 PM       all      0.00      0.00      2.00     52.00      0.00     46.00
09:31:20 PM       all      0.00      0.00      0.00      0.00      0.00    100.00
09:31:21 PM       all      0.00      0.00      1.00      0.00      0.00     99.00
09:31:22 PM       all      0.00      0.00      0.00      0.00      0.00    100.00
09:31:23 PM       all      0.00      0.00      1.00      0.00      0.00     99.00
09:31:24 PM       all      0.00      0.00      0.99      0.00      0.00     99.01
Average:          all      0.14      0.00      0.71     17.83      0.00     81.31
[root@myvm1 ~]#
Now in the above command, i have asked sar to populate the ouput of the system statistics every 1 second for 7 times.
The %iowait will tell you the iowait time taken by the system at each second. Running this command, also will let you know about the IO stats of your system.
How to identify which process is taking heavy IO in linux?
For getting an overview of processes and understanding some interesting facts about processes in linux, i recommend reading the below post.
Read: Processes in Linux
you can identify that with the help of top command. By sorting the output by "page fault count" this can be done by pressing "F" and then press "u" to sort it according to page fault in top command.
top - 21:43:58 up  3:45,  2 users,  load average: 0.15, 0.11, 0.06
Tasks:  87 total,   1 running,  86 sleeping,   0 stopped,   0 zombie
Cpu(s):  0.0%us,  0.0%sy,  0.0%ni, 99.0%id,  0.0%wa,  0.0%hi,  1.0%si,  0.0%st
Mem:    515444k total,   466932k used,    48512k free,   300748k buffers
Swap:  1044184k total,      108k used,  1044076k free,   106780k cached
 PID USER      PR  NI  VIRT  RES  SHR S %CPU %MEM    TIME+  nFLT COMMAND
 4413 root      15   0 23596 7424 4308 S  0.0  1.4   0:00.26   59 httpd
 4293 mysql     15   0  129m  20m 3200 S  0.0  4.1   0:01.64   54 mysqld
    1 root      15   0  2064  624  536 S  0.0  0.1   0:02.49   19 init
16490 root      15   0 10148 3176 2616 S  0.0  0.6   0:00.90   18 sshd
 3180 root      15   0 10064 2832 2084 S  0.0  0.5   0:00.11   10 cupsd
 3184 root      15   0   780  240  204 S  0.0  0.0   0:00.02    6 tpvmlp
The above output shows that, httpd and mysql is taking the large number of "page fault counts"
iostat command also provides some detailed information about the io usage in a linux system
iostat will provide sequential io and also random IO in its ouput. Sequential IO is the ability of the system to read a write large amounts of sequential data.(this also depends on the block size of your file system).
[root@myvm1 ~]# iostat -xk
Device:         rrqm/s   wrqm/s   r/s   w/s    rkB/s    wkB/s avgrq-sz avgqu-sz   await  svctm  %util
sda              14.21     3.59 165.10  1.20   449.42    19.13     5.64     0.05    0.33   0.15   2.56
sda1              0.09     0.00  0.08  0.00     0.10     0.00     2.60     0.00    0.62   0.50   0.00
sda2              1.33     3.58  6.09  1.19    57.65    19.08    21.08     0.04    5.83   1.93   1.41
sda3             12.71     0.01 158.89  0.01   391.59     0.04     4.93     0.01    0.08   0.08   1.19
sda4              0.00     0.00  0.00  0.00     0.00     0.00     2.00     0.00    5.20   5.20   0.00
sda5              0.08     0.00  0.04  0.00     0.07     0.01     3.44     0.00    0.72   0.56   0.00
iostat will show you the details of each of your disk partitions as shown above.
devide read/sec with the readkb/sec and w/s with wkB/s to get the IO performance of the device.
Another imporatant case to consider is, when you are running out of RAM. In that case, the system will start to use swap space. As swap space is nothing but hard disk space, IO speed will be very slow.
And if the swap space is in the same filesystem partition where the system is accessing IO for other application's, then your system will experience a very heavy slowdown.
Sometimes in the above scenario, your system will experience a kernel panic or system crash.
I will be coming up with part two of this post. Hope this post was helpful...
 Sarath Pillai
 Satish Tiwary
Comments
Thanks, very nice article!
Thanks, very nice article!
Note: "watch" command is usefull here to provide periodic poll of commands that don't support interactive run. Its also possible to get a group output of commands ofc.
very insightfull
very usefull info when digging into io performance problems!
clearfull
thx.
but 'dstat' is better than 'iostat'.
give it a try
Wait on input and output operation
Nice articles, it's very useful for me.
I/O WAIT
WHAT A CLEAR EXPLANATION . THE WAY YOU EXPLAIN IS VERY WELL AND VERY USEFUL TO ME.
THANK YOU.
Linux System IO monitoring
Thank you! Great article, very informative.
Add new comment