What is Nagios: An Introduction to enterprise level server monitoring


Any internet based service company like for example web hosting, DNS hosting, Email-hosting, Cloud architectures, and even CDN networks have server's ranging from several hundreds to thousands. There might be different roles that are played by different servers that are geographically isolated from each other. As a whole these geographically separated servers might be providing a combined service to the end customer. A particular issue or problem on any of the server should not affect the customer service, and must be found and fixed before the outage happens.
Let's take two examples which will explain the need for a 24 x 7 monitoring of these servers. Suppose that you get a call from your technical support team saying that several customers are complaining about their websites being inaccessible. Such complaints without any other details are very difficult to troubleshoot, if you do not have a 24 x 7 server monitoring in place. During crisis, you cant waste time by checking the basic below mentioned things.
- Server Disk Space
- Swap and memory utilization
- Processes and its status
- Load on the server
- RAID array status
- File system mount status
- Web server status
Because its quite normal to miss some or the other, by manually looking for basic issues on the server. What if the issue that was causing the problem was simply due to a RAID drive failure, due to which one of the disks were inaccessible( which contains the document root for some websites hosted ).
Such problems can be monitored for and can be warned before a complete failure occurs. Another funny example would be to find that a customer facing service was not working as desired for hours, simply due to a lag in time from a Network Time Server.
It is not at all feasible for a system administrator to look each and every log, and service settings, and other configurations round the clock. There needs to have some automated tool to continuously keep on monitoring these required services and settings on the server, and inform the concerned people in case of an issue. A good server and infrastructure monitoring tool must have the following characteristics.
- Must have a web interface which clearly outlines the issues that a particular host/server has.
- Must inform different concerned people in case of an issue.
- Must send pagers, mails, and text messages to the developers and system administrators concerned with a particular service failure.
- The tool must have the capability to take actions such as restarting a service, based on the current status.
What is Nagios
Although there are many proprietary monitoring tools out there to select from depending upon the requirement, no proprietary tool can provide the peer review, source code modification, and version iterations that an open source tool provides.
Nagios is an open source server and network monitoring tool that provides all those capabilities we discussed above in one package. Nagios monitors the servers and network devices(in fact i must say any network device which is accessible with an IP address can be monitored using Nagios) and alerts you when a particular service that's being monitored goes wrong, and also will alert you when the service comes back to normal required state. Nagios is capable of doing the following things.
- Monitoring of different services on a server, such as SMTP, HTTP, POP, IMAP, PROXY, and the list goes on. In fact you can make nagios to monitor anything on the server(You just need to make a custom script according to your requirement)
- 24 x 7 monitoring of server resources like CPU, Memory, Swap, Load
- A nice web interface which indicates the status of the services by three methods OK, Warning, Critical
- Maintaining a different set of contact groups(which will contain email addresses of different concerned people), based on the service
In this tutorial, we will be having a look at the major components of Nagios, which helps nagios to complete its task of maintaining a good monitoring infrastructure.
Let's begin this tutorial by understanding how a nagios server checks the status of a remote service on a remote server, and accurately report the output to you. In the world of nagios you will too often hear a term called plugins, which are readily available binary or small script based program, that checks the status of your required service or program.
Nagios checks the status of a remote service or program in multiple ways. Let's understand them one by one.
(1) Directly monitor services through network
In this first method the nagios server will execute a plugin on the nagios server itself, which will basically try to connect to a network service on the target server. Lets understand this through the following diagram.
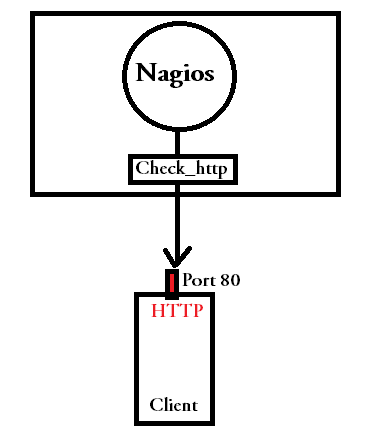
In the above shown diagram, we have tried to depict how nagios process execute an example check(which is also sometimes called plugin), on the nagios server itself, which will connect to the http port 80 on the target server, and will record the response time.
Nagios server will execute the check at regular interval(as configured), to check the availability of the service. In the above shown example, the plugin is placed inside the nagios server, and no changes are done at the client side. You cant monitor all properties of a client that counts, through this method. This method can be used only to monitor, services that are available publicly. The main reason behind this is that, you need to login inside the client server, in order to monitor stuff like memory usage, process status, cpu load, and other stuff.
Hence this kind of plugins are very limited in its capability, but you can surely achieve a considerable amount of good 24x7 monitoring using this method, for publicly available services like SMTP, HTTP, DNS, FTP, PORT availability check, Remote MySQL & MSSQL etc.
(2) Nagios monitoring through SSH and NRPE
As mentioned in the previous method, without getting a login to the remote machine, the level of monitoring you can achieve is very limited, and also you cannot monitor all the services using that method.
You can achieve a 24 x 7 monitoring of the things that cannot be monitored directly through network with the help of two different methods, they are as mentioned below.
- Check the status of a remote service by executing a plugin, that will be placed on the remote client, by loging inside the client with the help of SSH.
Related: Working of SSH explained
- NRPE (Nagios Remote Plugin Executor), is a daemon that's installed as a stand alone or an inetd daemon that waits for requests from the nagios server on port 5666, to execute commands that are defined in its configuration file.
Let's frst undersand monitoring a remote host using SSH method. In this method, a user is made on all the client machines, which allows ssh login from the nagios server with the help of a predifined ssh key and execute a requred plugin to monior a required service.
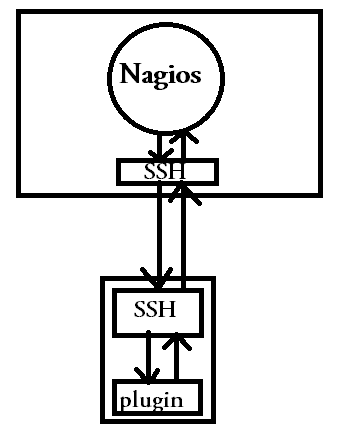
This method of executing remote plugins on remote client with the help of SSH is a secure way to monitor. As a normal user logs in the remote client, the nagios server will be able to run any command that the normal user will be able to run(when i say run, i mean execute).
the plugins that reside in the remote client are sometimes called as local plugins as they are local to the remote host. to run local plugins on remote host, nagios uses a ready made command called check_by_ssh(we will be discussing the complete command usage of this plugin in a dedicated post of its own).
of cource you will not be sitting and entering passwords each and every time the check is executed by the nagios daemon. Login and execution of the remote plugin on the remote server using ssh must be seamless and also must be password less login. For this, you need to set up public key authentication of the user, which will be loging inside the remote server for executing the plugins.
Now let's see the another method of executing remote plugins.
Another method that is commonly used to achieve the successful execution of a remote plugin is NRPE. NRPE stands for Nagios Remote Plugin Executor. NRPE is a package that will be installed on all the remote hosts, that needs to be monitored. Mostly NRPE is installed as Xinetd service on the remote host, and by default it listens on the tcp port 5666.
Suppose the nrpe daemon receives a query from the nagios server, to execute a command on the local server, nrpe daemon looks inside the nrpe configuration files, for a command with the same name what nagios asked to run. Unlike ssh method, nrpe cannot run any command that the nagios server asks to run. Commands first need to be defined inside the nrpe configuration file. And only those commands can be run from the nagios server. Deploying ssh based nagios checks are much easier compared to nrpe method, because in nrpe method, you need to first install nrpe package on all the client servers that requires to be monitored.
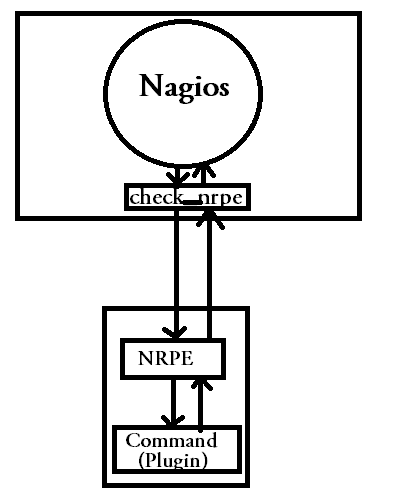
Above diagram depicts the nrpe method of executing remote checks on a remote client with nagios. Nagios server has a check_nrpe plugin (which is very similar to the plugin check_by_ssh used in ssh method), which connects to the remote client on the port 5666, and executes the command, which is given as an argument to check_nrpe plugin(the command given as argument to check_nrpe plugin on the nagios server must also be defined in nrpe configuration files on the client, where the command will be executed.)
Nrpe method of monitoring remote host, by executing plugins on the remote machine is limited to the commands defined inside the nrpe configuration files on the client. Which means the command which you require to run on the remote machine, must be predefined in the nrpe configuration files on the client.
But check_by_ssh can be used to run any command, with executable permission to the user used to login to the remote machine.
Let's go ahead and understand the remaining two methods that can be used to monitor a remote host in nagios monitoring.
(3) Monitoring remote host with the help of SNMP in nagios
SNMP can be used to fetch the current value of different properties of a network device or any SNMP aware device. if you have SNMP daemon installed on your remote host, which needs to be monitored, then you can monitor hard drive, load, etc with the help of SNMP daemon.
Advantage behind using SNMP to monitor is because it is supported by a wide variety of devices like network switches, routers, UPS devices etc.
We will be doing a couple of posts on SNMP, for getting a better overview of the protocol and its usage. We will also be doing a dedicated post for monitoring devices with nagios and SNMP.
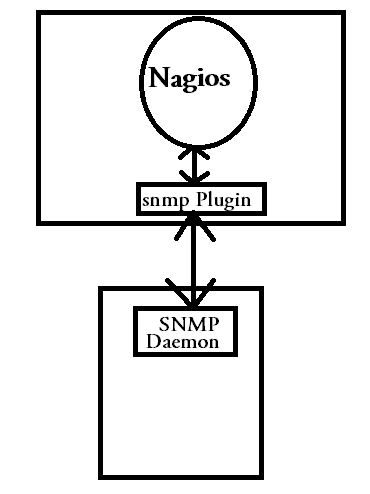
Above case of monitoring with snmp places the plugin inside the nagios server itself, which will be a generic snmp plugin that will be used to monitor all snmap related services, with different arguments given to it.
(4) Nagios Passive monitoring or NSCA (Nagios Service Check Acceptor)
Until now we have seen around 4 different methods, used to monitor a remote server using nagios. All of them worked by either a plugin placed on the nagios server or a plugin placed on the client, or by simple monitoring or publicly available service. In all the above mentioned method, the plugin execution or say command execution was initiated by the nagios server.
Let's now see a method, in which the client will execute a required plugin at a regular interval, and report the output of the execution to the nagios server. This is achieved with the help of a daemon called NSCA.
NSCA stands for Nagios Service Check Acceptor. This is installed as a daemon on the nagios server itself, and it will wait for the command result from the client.
This kind of nagios monitoring is called as passive monitoring, because nagios server is not the one that initates the checks on the client, but the client will execute the plugins specified, at regular interval with the help of a cron and report the output to the nsca daemon on the nagios server.
While reporting the output, the client will also send details like the service name, hostname, the output of the command executed to the nsca daemon, so that the nagios server can report the output exactly in the same way active checks are executed(active checks are those checks in which the command execution is initiated by the nagios server. Examples are check by ssh, nrpe etc.)
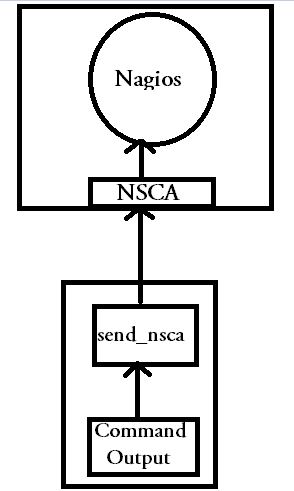
There are couple of things that needs to be understood, from the above shown diagram. NSCA is a daemon on the nagios server that waits for the command result from the client.
Send_nsca is a program that can be used to send a command result to the nagios server. The hostname, the service name, and other related details will be included in the command result send using send_nsca to the nagios server.
In this tutorial we saw different monitoring methods, used by nagios server to monitor a client. Reading this introductory post on nagios monitoring is very much important to understand our upcoming posts on nagios.
Our upcoming posts will contain installation, configuration of different monitoring methods discussed here, command line options, and other stuff. Nagios pretty big a topic, so we will be discussing it through a number of different dedicated posts on different nagios topics.
Hope this introductory tutorial was helpful, in getting started with nagios monitoring.


 Sarath Pillai
 Satish Tiwary
Comments
nagios over snmp
Hi, i do have Nagios implemented over snmp based method. in this we are using snmpd.conf file on each client as below
rocommunity public@12345 172.16.57.227
rocommunity public@12345 127.0.0.1
syslocation 172.16.57.227
syscontact Mayur Murkya
port 161
interface eth0
com2sec local localhost public
com2sec mynetwork 172.0.0.0/8 public
com2sec ossbss 10.135.4.0/24 public
group MyRWGroup v1 local
group MyRWGroup v2c local
group MyRWGroup usm local
group MyROGroup v1 mynetwork
group MyROGroup v2c mynetwork
group MyROGroup usm mynetwork
group MyROGroup v1 ossbss
group MyROGroup v2c ossbss
group MyROGroup usm ossbss
view all included .1
access MyROGroup "" any noauth exact all none none
access MyRWGroup "" any noauth exact all all none
load 12 14 14
here, what "load 12 14 14" does..?
Nagios over SNMP
Hi Mayur,
Could you ask this question in our forums? Couple of days back we launched our forums. You can register there and ask this question there..
I will be answering it there.
Register here: https://www.slashrootforums.org/user/register
Thanks
Sarath
Add new comment