Introduction to ganglia monitoring and graphing tool

Every system administrator needs to find some or the other way to monitor the servers that are under them. There are many number of tools available in the market such as nagios,hyperic etc.
If the task is to manage a few handful of machines then its not a big deal. But to have an overview of thousands of machines in the network and to have all the properties of all those machines arranged in a trending manner in one interface is a good solution to identify bottlenecks if any.
If a such a monitoring solution exist then it should address the following things.
- Graph different properties of a server such as cpu,memory,load,etc
- compare the graphing trend of those properties with previous trend.
- identify which node or host is causing the issue easily from the trend.
- Make custom metrics for graphing for different process.
- machines from different data centers which are part of one single cluster must be represented in that single cluster in a single interface.
There are proprietary monitoring solutions available but those do have some issues like the following.
- Such a tool is very much expensive
- And the administrator needs to wait for the vendor to roll out the update or patch or sometimes even wait for a feature.
- Most of them have performance issues
Ganglia monitoring tool is a perfect solution for all those above mentioned problems.
Uses of Ganglia
- Ganglia monitoring tool is primary built for monitoring clusters of servers, and it does its job at the best.
- It represents the overall performance of a cluster of servers in an overview
- Suppose you have multiple clusters in a datacenter, then in that case you can arrange them and call it as a grid and have an overall performance overview of that grid.
- Performance monitoring to the base machine of a collection of virtual machines, can be done using ganglia monitoring tool.
There are some concepts and terminologies that we need to understand before we further explore ganglia monitoring tool such as the below ones.
Node: Its a single machine that sends different monitoring data to the ganglia monitoring daemon, each and every server that needs to be part of a cluster is a node. So we can call each machine is a node.
Cluster: All nodes that are used for some particular purpose can be a cluster, we can define in the node(a server), what cluster it belongs to.
Grid: Grid in terms of ganglia means that, its a collection of clusters or we can group a number of clusters and call them a grid, which means suppose in London data Centre we have 4 clusters or servers for different tasks. We can call those clusters collectively as London grid or whatever name we like. The main part is that we can have an overview of the grid's performance in one web interface.
Different parts of Ganglia monitoring tool
Gmond: Gmond stands for ganglia monitoring daemon. This is a small service thats installed in each and every node(node from here onwards means each server that needs to be monitored) that needs to be monitored. This daemon sits on the machine (node) and collects all metric information and sends via XML over TCP. Gmond has the capability to collect many number of metrics like CPU,memory,load and many more custom metrics.
Things to note about gmond:
this must be installed on all the nodes which needs to be monitored.
The main configuration file of gmond is /etc/gmond.conf
gmond is multithreaded
each gmond transmits information’s like host state etc. by uni-casting or multicasting
Gmetad: this is the daemon that collects data from other gmetad daemons and all the gmond daemons.
This gmetad stores the data it collects in the form of an rrd(round robin data base).
Things to note about gmetad:
the main configuration file for gmetad is /etc/gmetad.conf
You need atleast of gmetad daemon installed node on each cluster.
This gemetad daemon is the one who collects data send by gmond daemon.
All other nodes other than the one in the cluster, do not require gmetad daemon to be installed.
If you need the machine containing gmetad configured as node to be monitored, then in that case you need to install both gmond and gmetad on the machine.
Gmetad polls different data sources for collecting data and storing, the different data sources include other gmetad daemons (which might be representing a cluster),and gmond daemons
RRD tool:
Ganglia uses RRD tool to store its data and visualization.
RRD tool is the short form for Round Robin Data base tool. This is a wonderful and useful open source data base tool. In this RRD stores data in time-series. For example RRD tool will store all values of CPU load at a certain time interval and then graph these data according to time.(Don't worry we will do a dedicated post on RRD and Round Robin Data Base.)
Remember one thing that RRD is at the heart of ganglia in graphing.
A web server With PHP:
Now you require a web server with PHP enabled to represent the graphs plotted by the rrd tool. Using apache is a nice choice because most of the people who deployed ganglia to monitor their clusters are running it with apache.
Although it can be easily run with other web servers too.
A machine with PHP version 5 installed is recommended.
How does Ganglia Work?
The below diagram might give some idea of how ganglia works.
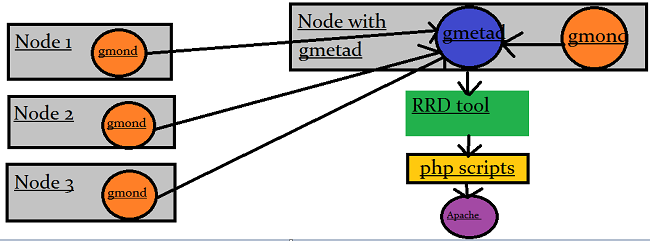
From the above diagram we can see that node 1,2 and 3, have gmond installed in them and send data to gmetad installed in "node with gmetad". There can be one or more than one "node with gmetad" in a cluster.
The diagram clearly states that gmetad collects all the data from gmond and stores it in rrdtool database. Which is then collected by the php scripts, and represents all the data collected in a representable manner. And a web server "apache" serves it at some url.
To have an idea of how ganglia graphs look like, see the publicly available Berkeley cluster graphs in action here in the below link.
http://monitor.millennium.berkeley.edu/
You can easily select different grids in that Berkeley's publicly available ganglia web interface. Grids will contain different clusters and clusters intern will contain individual nodes.
In the next post we will see how to install gmond,gmetad, and configure them. Hope this post was helpful in understanding how ganglia works. Thank You...
 Sarath Pillai
 Satish Tiwary
Add new comment